You may have noticed a change to my review structure. Or, you’ve simply stumbled upon the reviews for the first time, and you want to know what the review scorecard means. You may also be interested in a Twitter Test Drive, and you want to know how your vehicles will be scored. There are two systems at work in my reviews; a scorecard, and a “star” system. I’ve put these in place in an effort to create a consistent and fair test for all vehicles. Let me take a moment to breakdown the review scorecard.
Here it is:
| Category | Score |
| Performance/Mileage | /10 |
| Comfort/Ride | /10 |
| Practicality | /5 |
| Entertainment/Infotainment | /10 |
| Reliability Index | /10* |
| /45 (/35*) |
Most of the items in the scorecard are self explanatory. Vehicles are assessed on 4 categories during the test: Performance/Mileage, Comfort/Ride, Practicality, and Entertainment/Infotainment. The fifth category is applicable only to vehicles which aren’t the newest entry in that model line. This number is a mathematical number based on the data from two online used vehicle sources. More on that later. For vehicles that are the first of their kind, or the first complete redesign of a model, this fifth field will be omitted, and the total score calculated using four categories. Let’s take a look at the first four categories.
Performance/Mileage
During the test I will make general observations based on how the vehicle performs. This will be compared to my perceptions of the vehicle, and competitor products if I’ve tested them. I track real life mileage for the duration of my Twitter Test Drive. In addition to being published in the final review, I will weigh the results against posted numbers, and the numbers of current class competition. Also measured here is information about the engine, transmission, and overall vehicle road performance. What I include under this heading may vary based on the vehicle tested.
Comfort/Ride
How a vehicle rides is important for customers. Canadian roads provide a unique test environment for the general comfort and ride quality a vehicle has. We have an eccentric mix of rough, winter torn roads, and freshly paved smooth ones. During my review, I will make observations about how comfortable the vehicle is. Ride comfort will consider the overall comfort of the interior, room presented to driver and passengers, and general road noise. Expect comments about ergonomics, accessory placements, and lighting.
Practicality
How realistically does this vehicle fit my families? How does it fare in real life? Marketing aside, here is where my review focuses on my daily experience with the vehicle during the test. A supplement/summary to the real time Twitter aspect. Perspectives focus around single driver city commute and young family (of 5) transportation.
Entertainment/Infotainment/Technology
As a techie, a vehicle’s technology options are a big deal to me. In a world where smartphones have become prolific, and bluetooth is nearly standard, this is an important consideration in a review. I will observe general usability of a system, user friendliness, and driver friendliness. Because of my familiarity and comfort with technology, expect the vehicle’s infotainment system to be thoroughly explored. As with other elements, I will draw comparisons against my expectations and systems in competing vehicles I’ve tested.
Now, get your math hats on, this is where things get very complicated.
Reliability Index
When buying a new vehicle, reliability is a big concern for customers. Unfortunately, most new car reviews fail to take a look at the current model’s performance. Reliability, however, is a very difficult thing to get a decent measurement on. I would submit the following system does a good job of capturing a vehicle’s potential reliability.
NOTE: For vehicles that are new to the manufacturer (never before produced), or a completely new redesign (total relaunch of a model), this measurement is ignored. It’s nearly impossible to predict reliability on a vehicle that shares little to no similarities to it’s predecessors.
How it works:
The Reliability Index is calculated using data on a vehicle from two sources (whenever possible): www.truedelta.com and www.motortrend.com. Data points from these sites have been pre-assigned a score, and a vehicle’s total score is a combination of the two.
True Delta uses data submitted by hundreds of thousands of users to provide information on a vehicle’s reliability. It provides information about how many repair trips an owner has had with that vehicle, how expensive they are, and what was replaced/repaired. It combines the data to provide a reliability score for the vehicle (number of repair trips as a percentage of vehicle owners). Here’s an example of data for a Toyota Sienna, 2011 and newer.
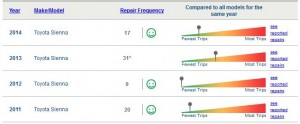
As you can see, each vehicle model year has a score assigned to them. In the case of the 2013 model year, we see there is an asterisk . This simply means the data size for that model year is too small to provide thorough data. In the event I see this result for a model year, I will ignore the result for that year. For a 2015 Toyota Sienna, we would average the score of all model years that share the same design. In this case it would be for all model years since 2011. True Delta results are assigned the following scores:
Green = 6 | Yellow = 3 | Red = 1
In this example, a 2015 Toyota Sienna would be assigned a True Delta score of 6 [(6×3) / 3]. 2013 result is omitted due to an asterisk.
The second piece to this puzzle comes from MotorTrend. MotorTrend has a great resource which provides an estimate of the vehicle’s cost of living. Here’s an example of the 2011 Toyota Sienna.
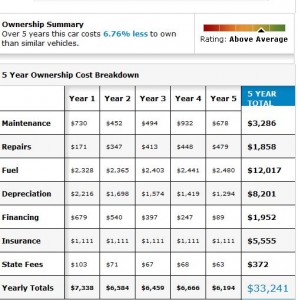
MotorTrend generates it’s data using a system called IntelliChoice. A score is assigned based on how much more or less a vehicle costs compared to others in the same class. As in the previous example, I take the average of all model years the current model has been active. In the case of the 2015 Toyota Sienna, we average the scores for all models since 2011. MotorTrend Cost of Ownership results are assigned the following scores:
Well Below Average = 0.8 | Below Average = 1.6 | Average = 2.4 | Above Average = 3.2 | Well Above Average = 4
In this example, our 2015 Toyota Sienna receives a MotorTrend Cost of Ownership score of 3.2 [(3.2×4) / 4].
The 2015 Toyota Sienna’s overall reliability score is a combination of these two elements. For this example, the 2015 Toyota Sienna would score 9.2/10.
Phew.
In short, I hope this is a fair and accurate way of measuring the potential reliability of vehicles. Data sources and scores provide a good generalization of what a customer should experience throughout the life of their vehicle.
The “Star” System
Total scores are assigned to each vehicle based on observations, and reliability calculations, if applicable. A percentage score is generated based on the total score / total possible score. Simple grade school type stuff. Based on the total percentage score, I’ll assign a total “star” score out of 5 – not unlike every review system online, or movie review you see. Star scores are based on the following:
5/5 = 90% and higher| 4.5/5 = 85% and higher | 4/5 = 75% and higher | 3.5/5 = 65% and higher | 3/5 = 60% and higher | 2.5/5 = 50% and higher | 2/5 = 40% and higher | 1.5/5 = 30% and higher |
1/5 = 25% and lower
Any vehicles which score 95% and higher receive the entirely useless, entirely not coveted, and lacking any prestige, Dan Seal of Approval.